Order & project
Set up orders, projects and tasks clearly. Responsibilities, deadlines and test steps stay visible in one shared state of work.

More value in the same time makes paveit an investment in the future.
paveit connects order, specimens, measurement, analysis and report in one continuous lab workflow.
Request a demoSet up orders, projects and tasks clearly. Responsibilities, deadlines and test steps stay visible in one shared state of work.
Assign the right specimens directly to the task and document material, sampling location and test conditions properly.
Upload measurement data straight from the test machine, check it and link it unambiguously to task, specimen and test method.
Parameters, charts and quality scores are created automatically from the measurement data and made ready for technical review.
Completed tasks flow automatically into the current project or work package report. The report always stays up to date.
Pavement Analysis and Design Tool
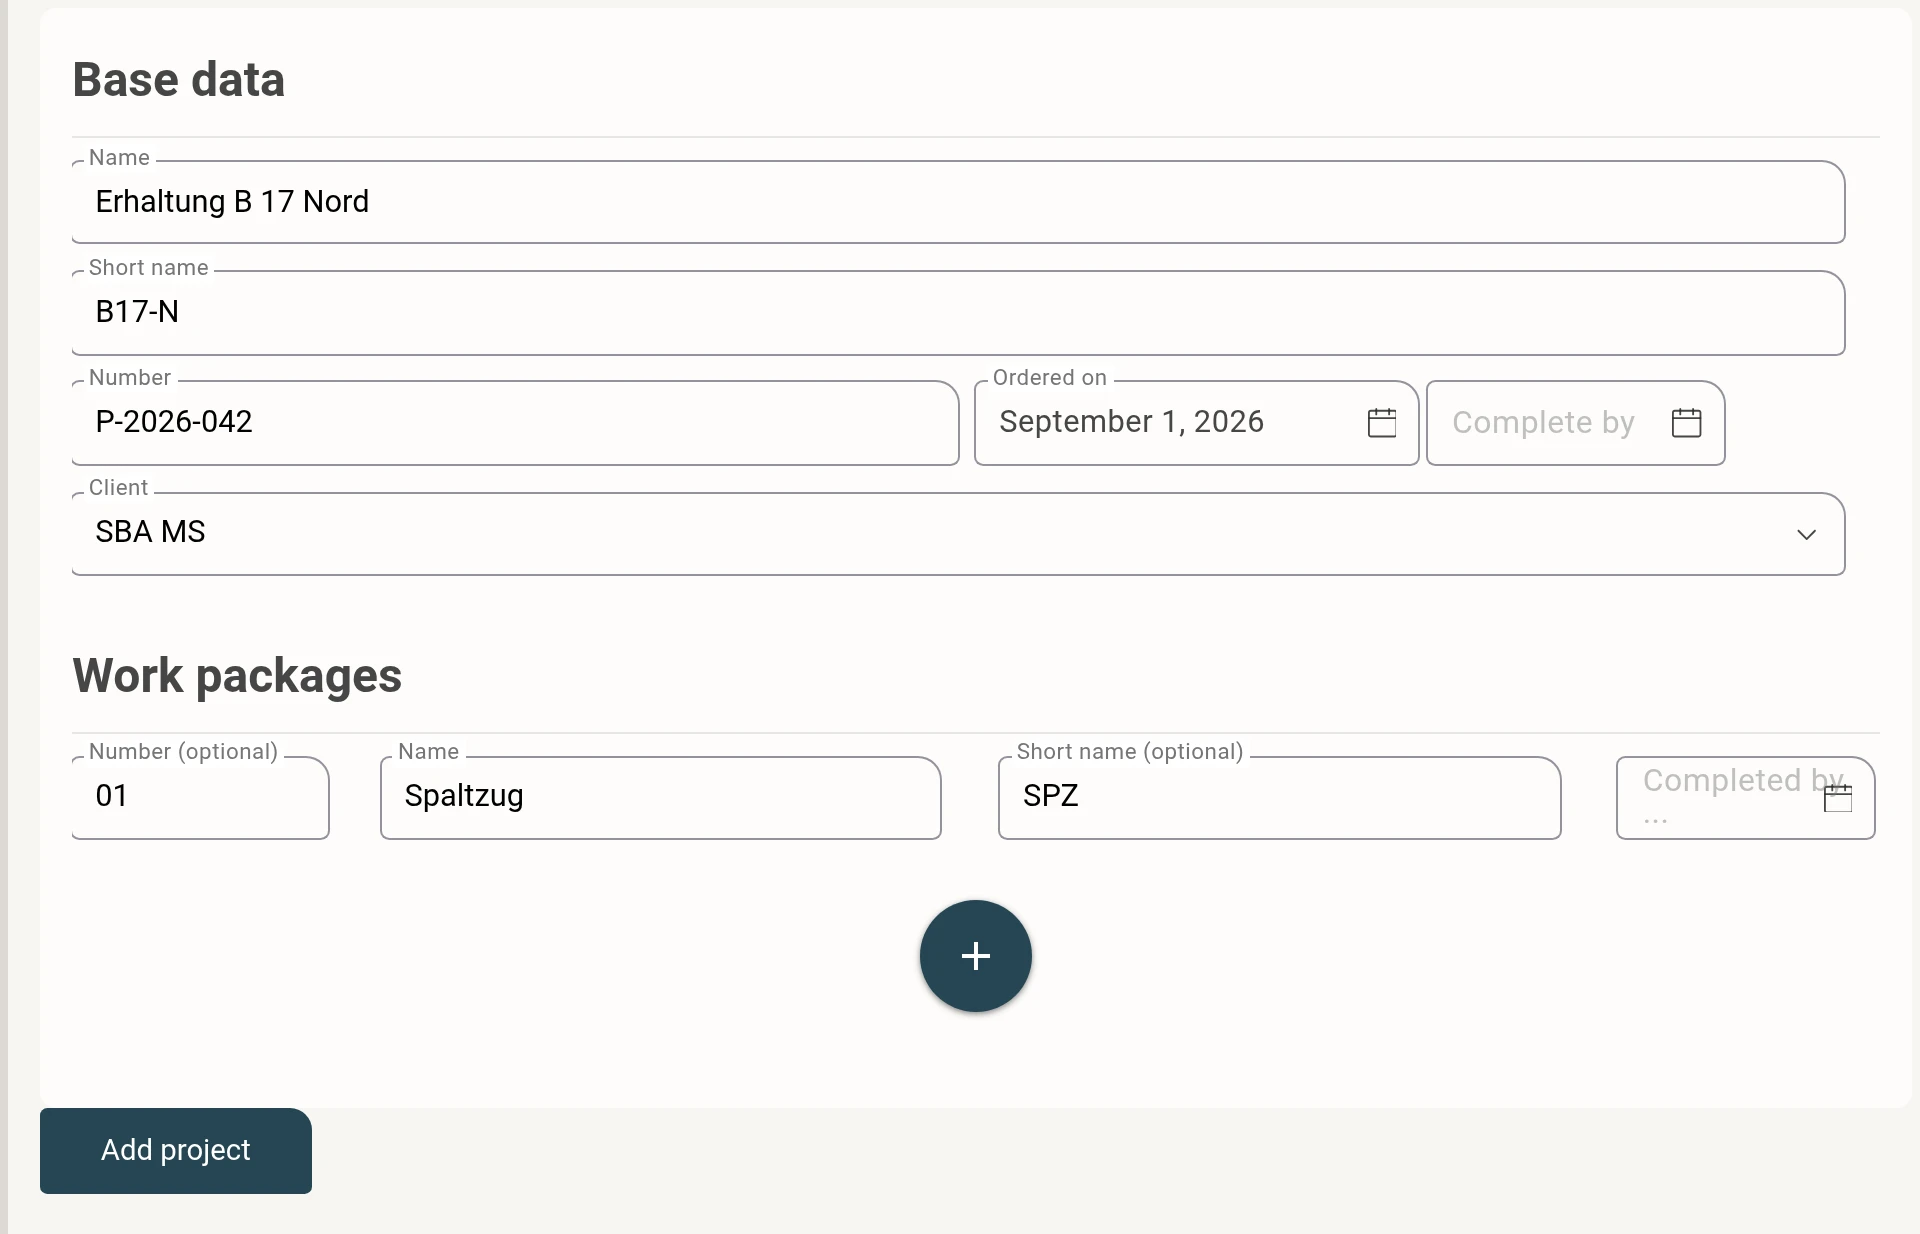
Every test starts with an order. paveit assigns it to client, project and work package – so everyone in the lab sees what is being worked on and how far a project has come. As a multi-user system with role-based access control, paveit lets your team work on tasks together.
Clients, projects and work packages in one place. How far a project has come follows from its tasks.
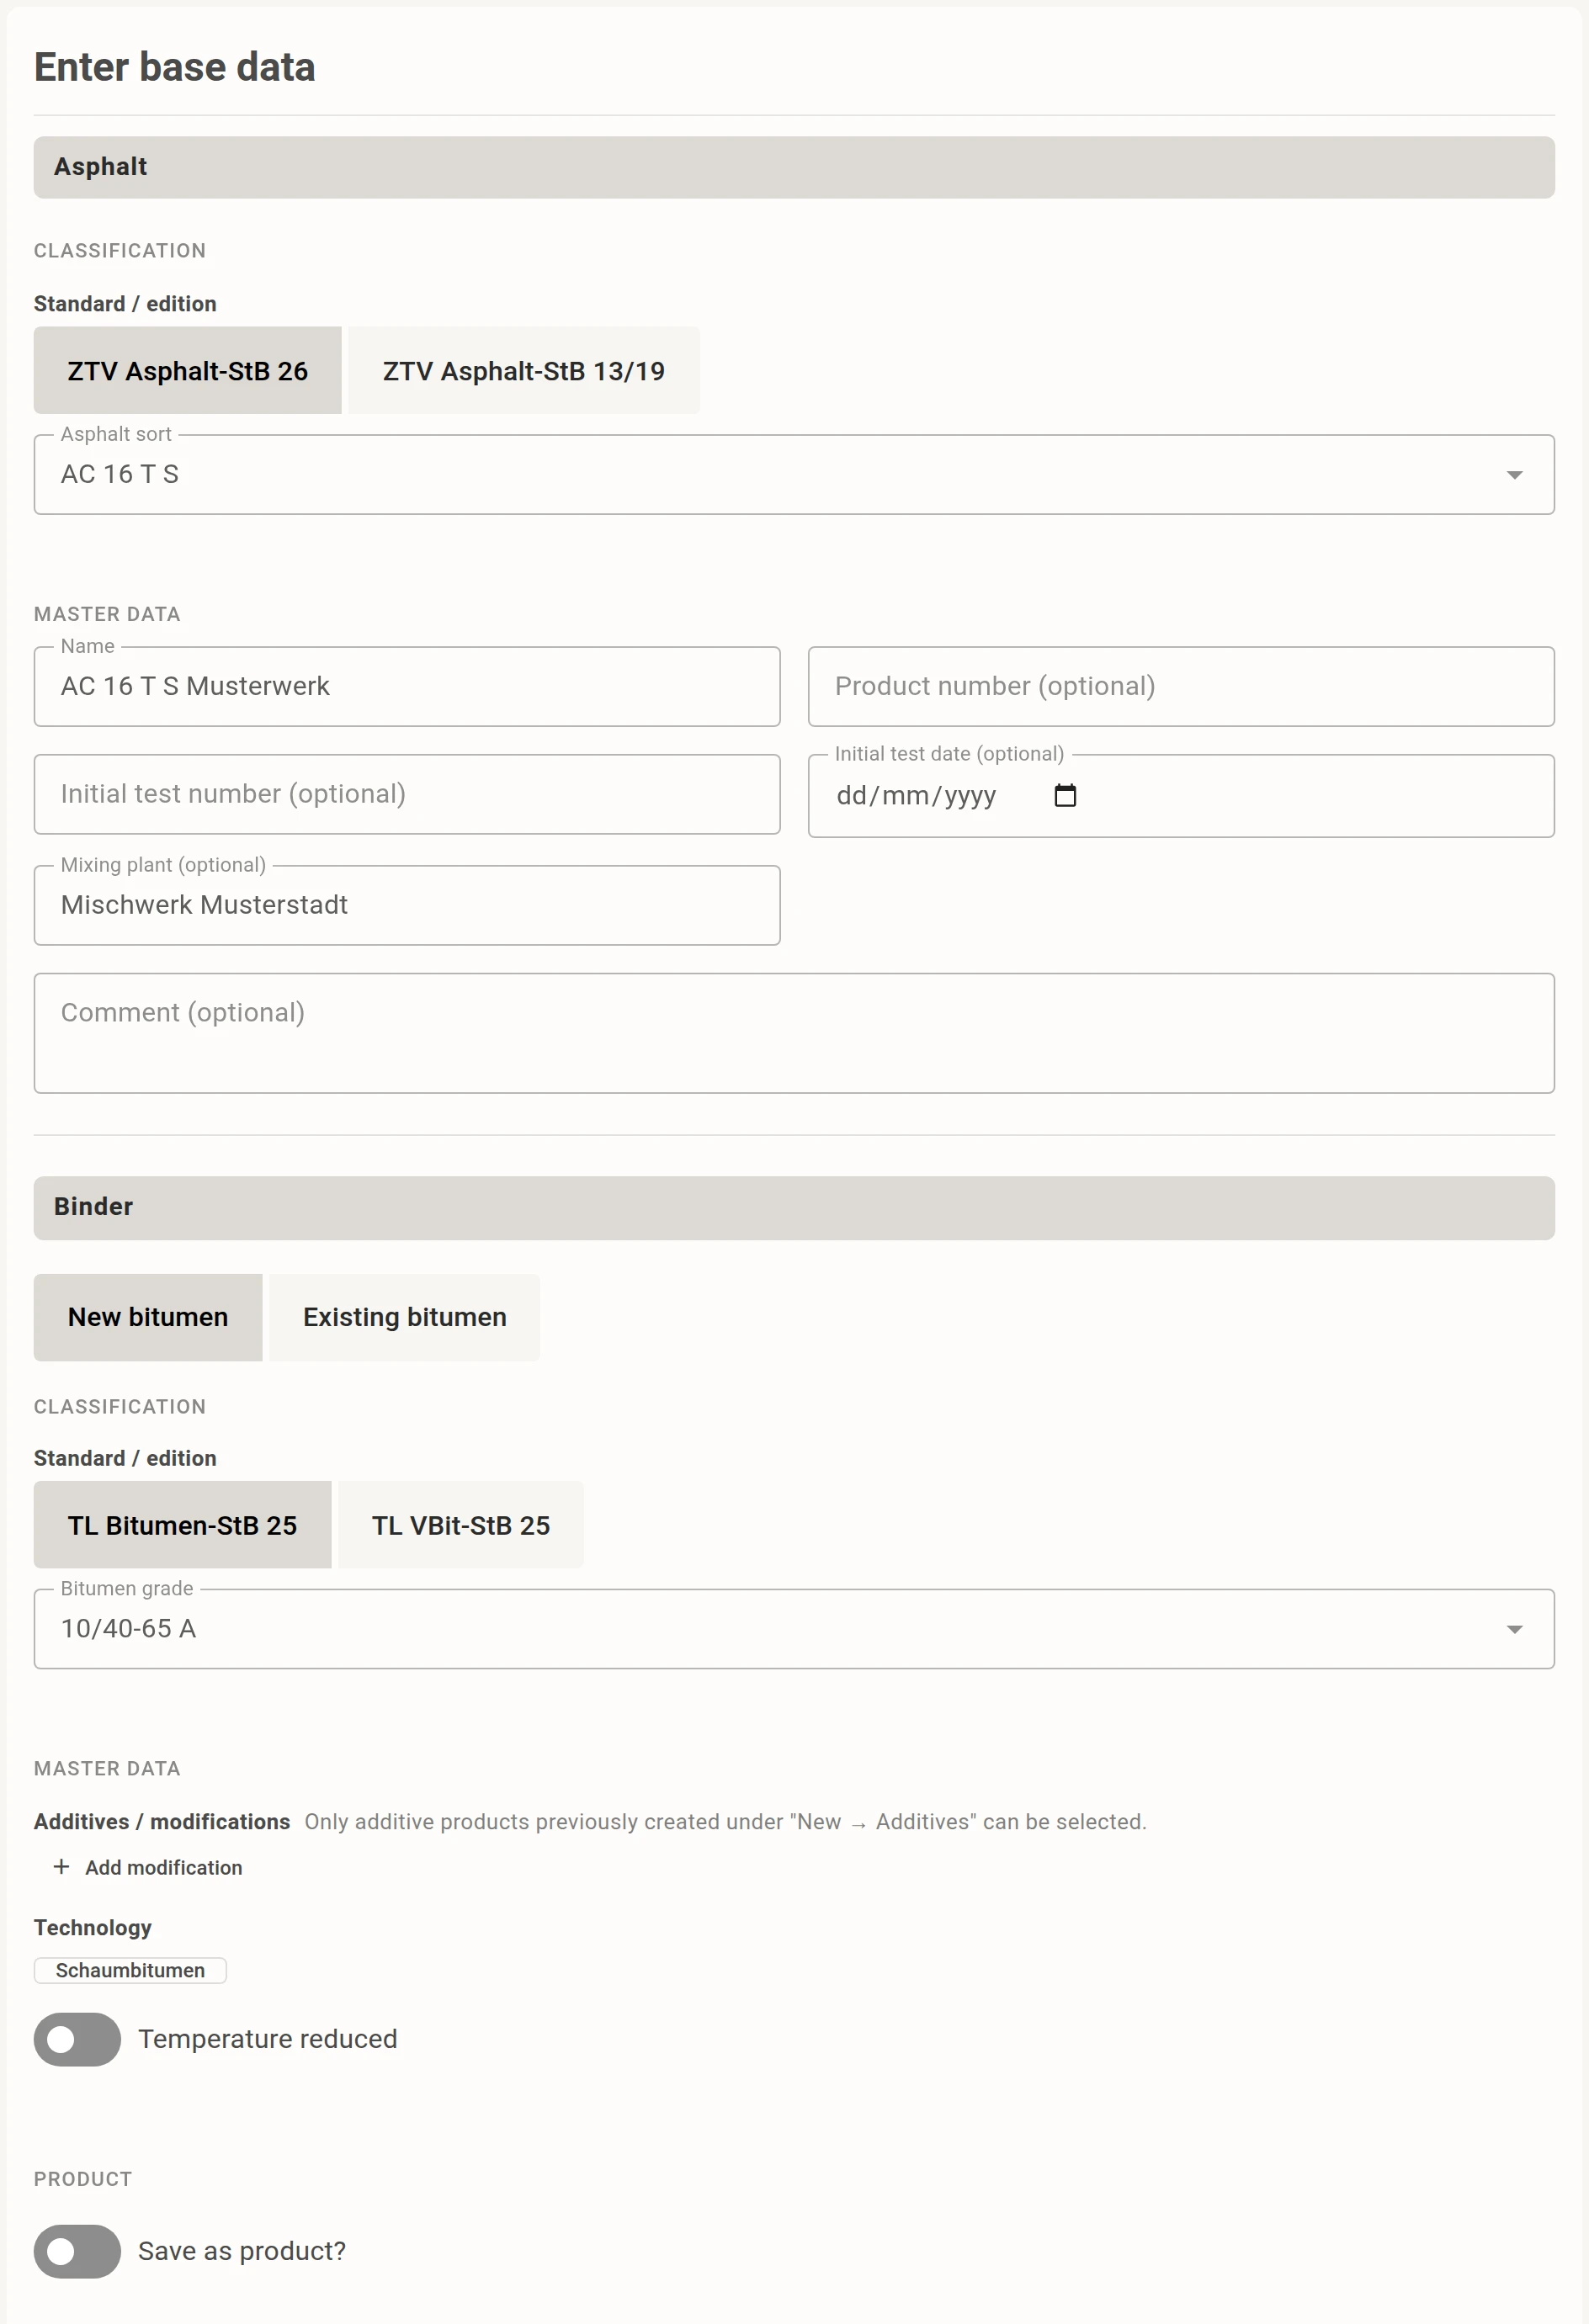
Choose asphalt type and binder from the lists of the standard instead of typing them. Matching bitumen grades come first.
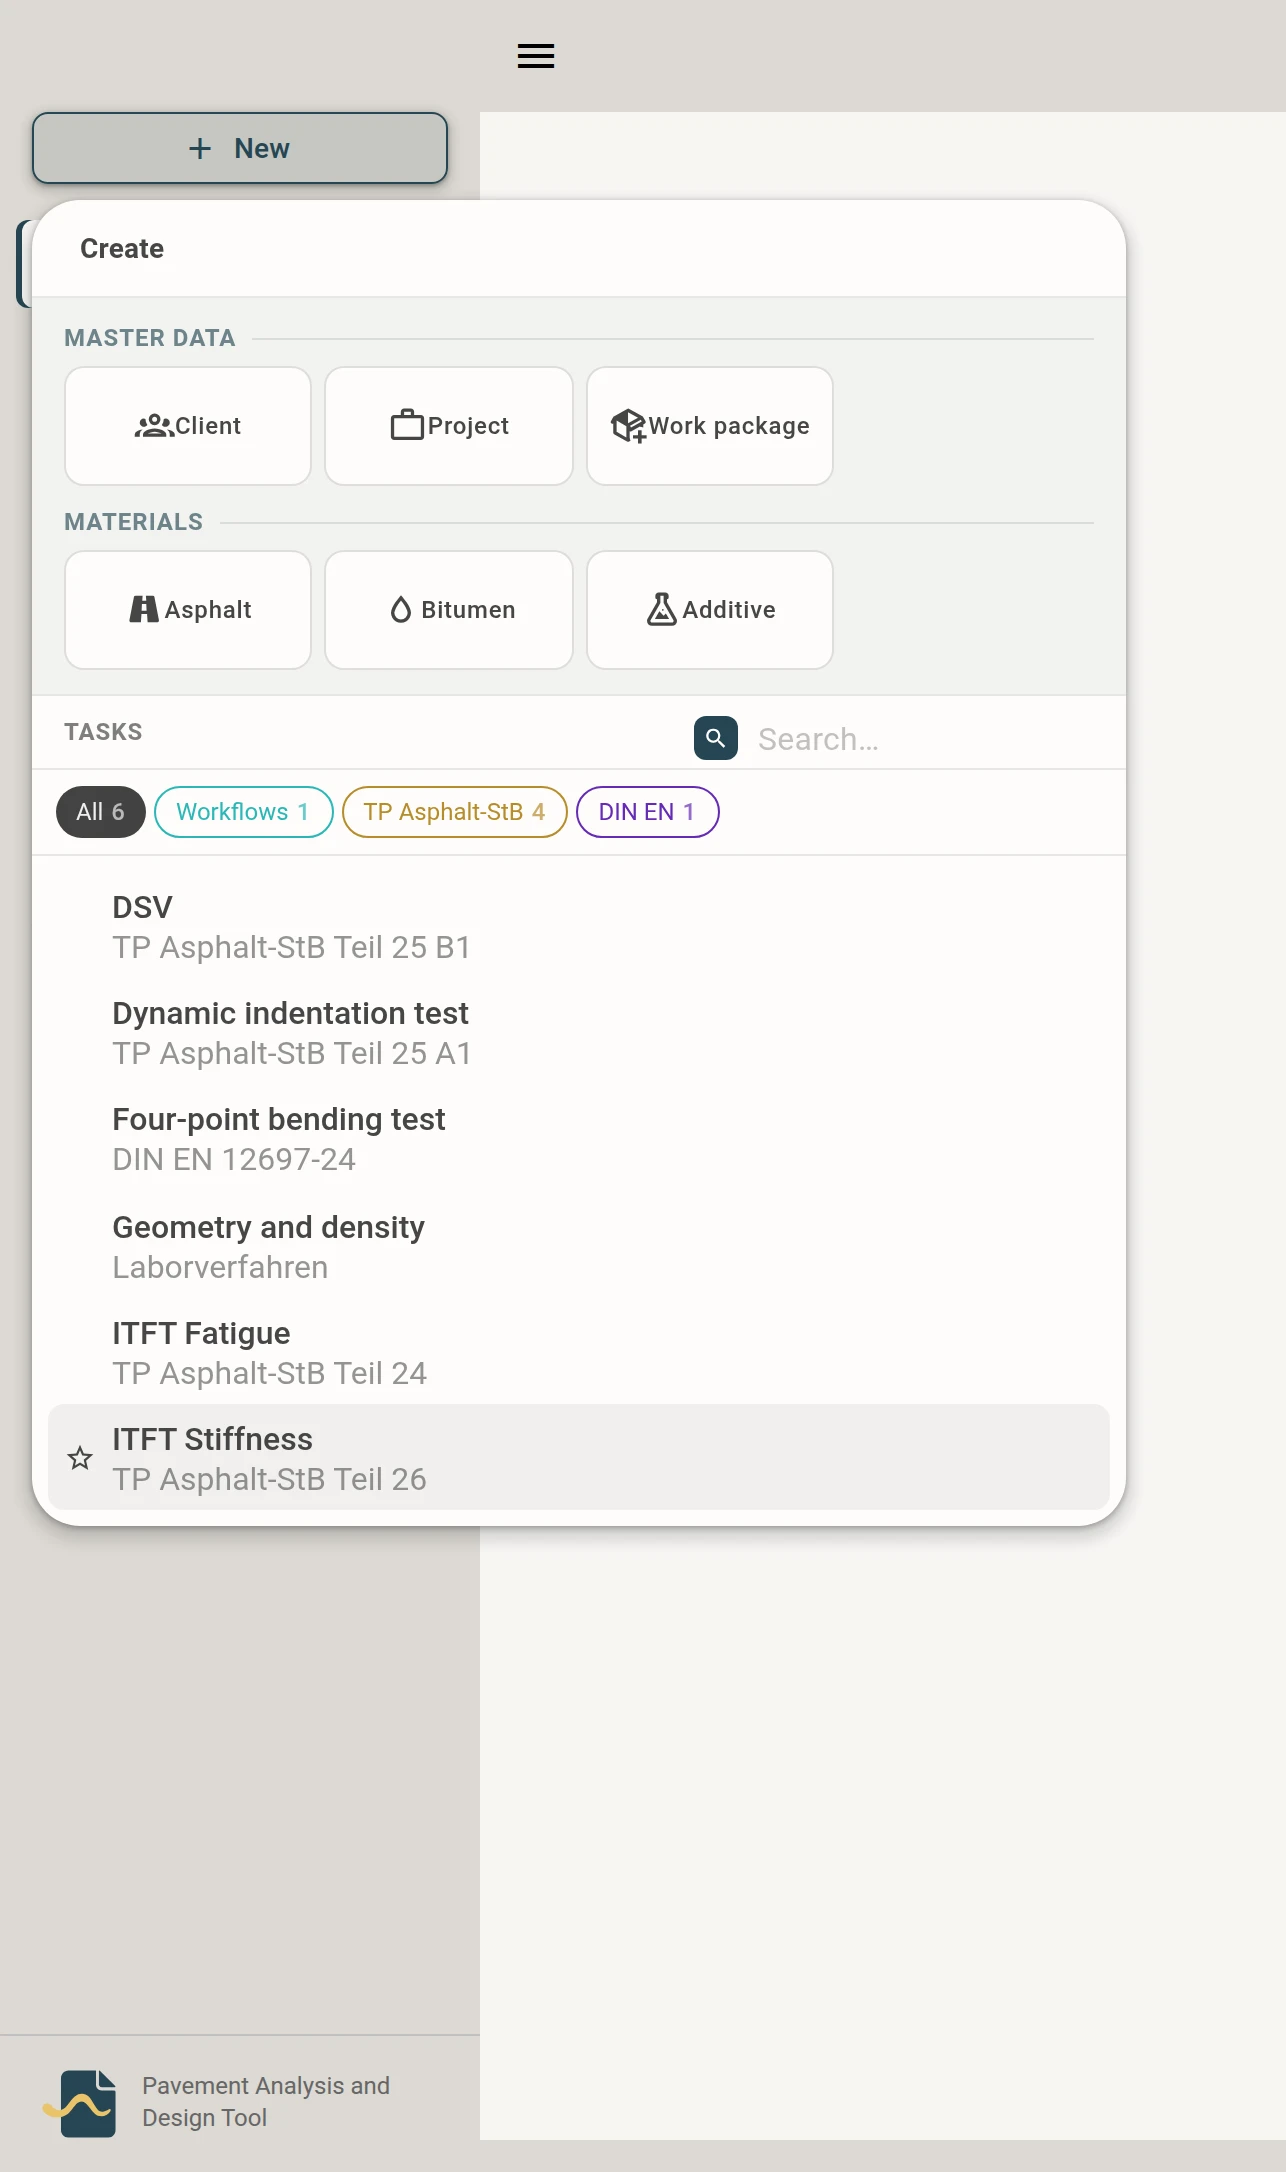
All tests are in the “New” menu; keep the ones you use often as favourites.
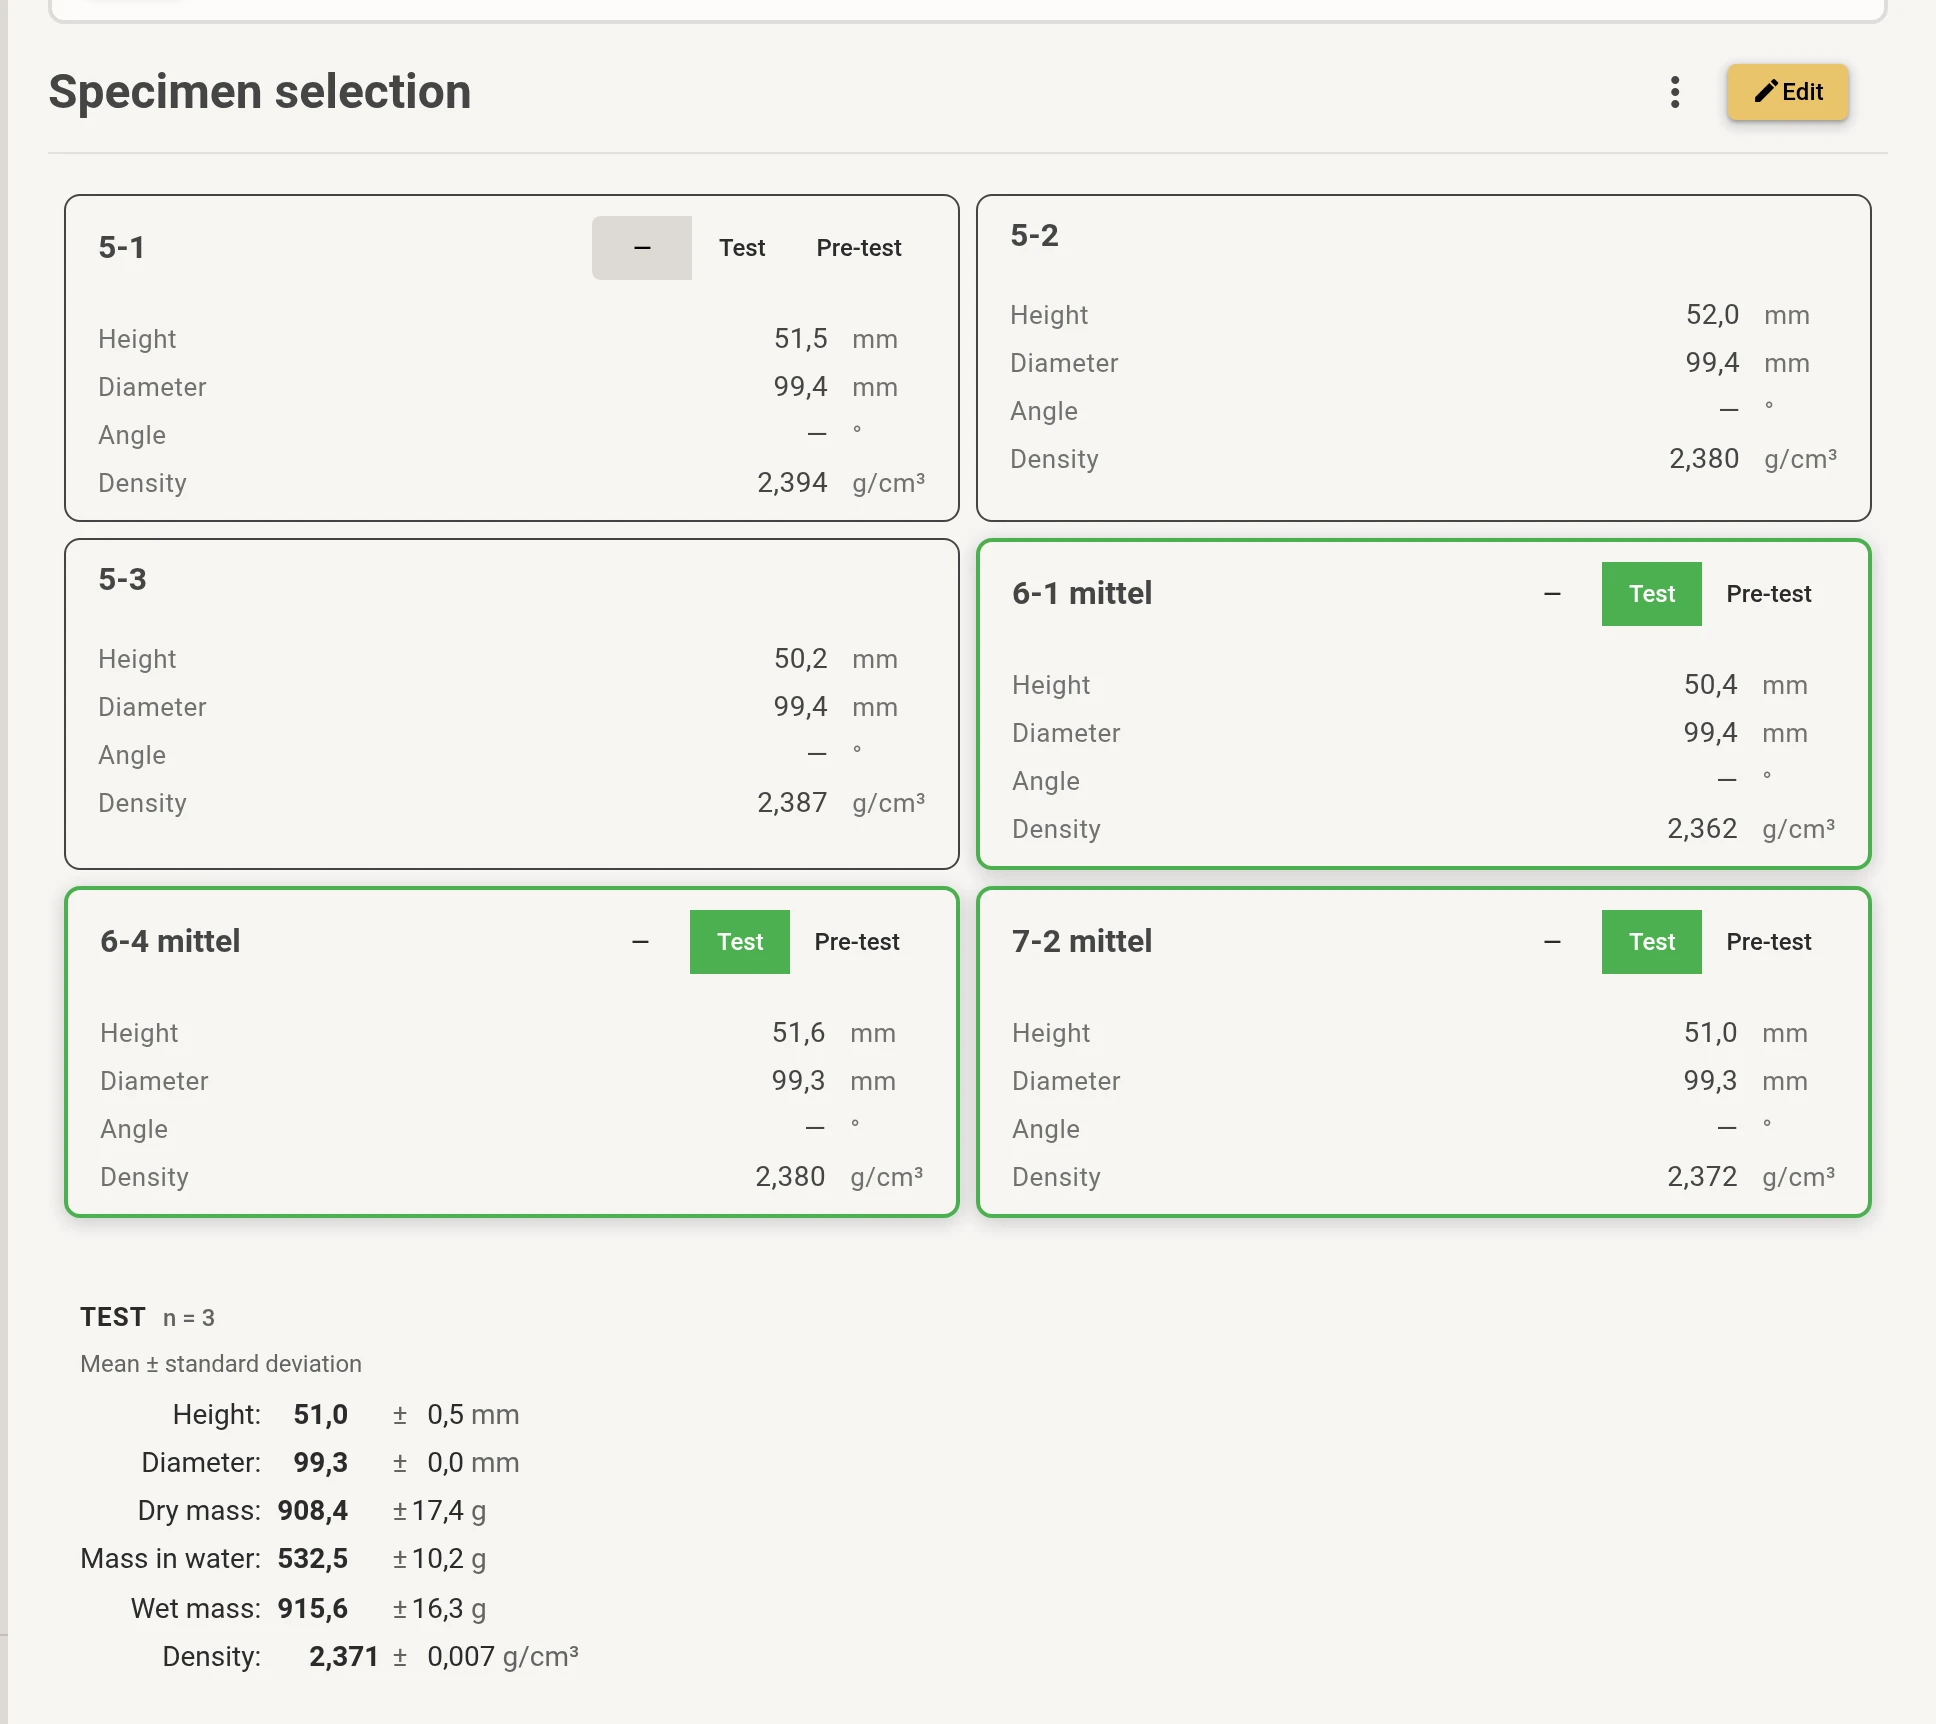
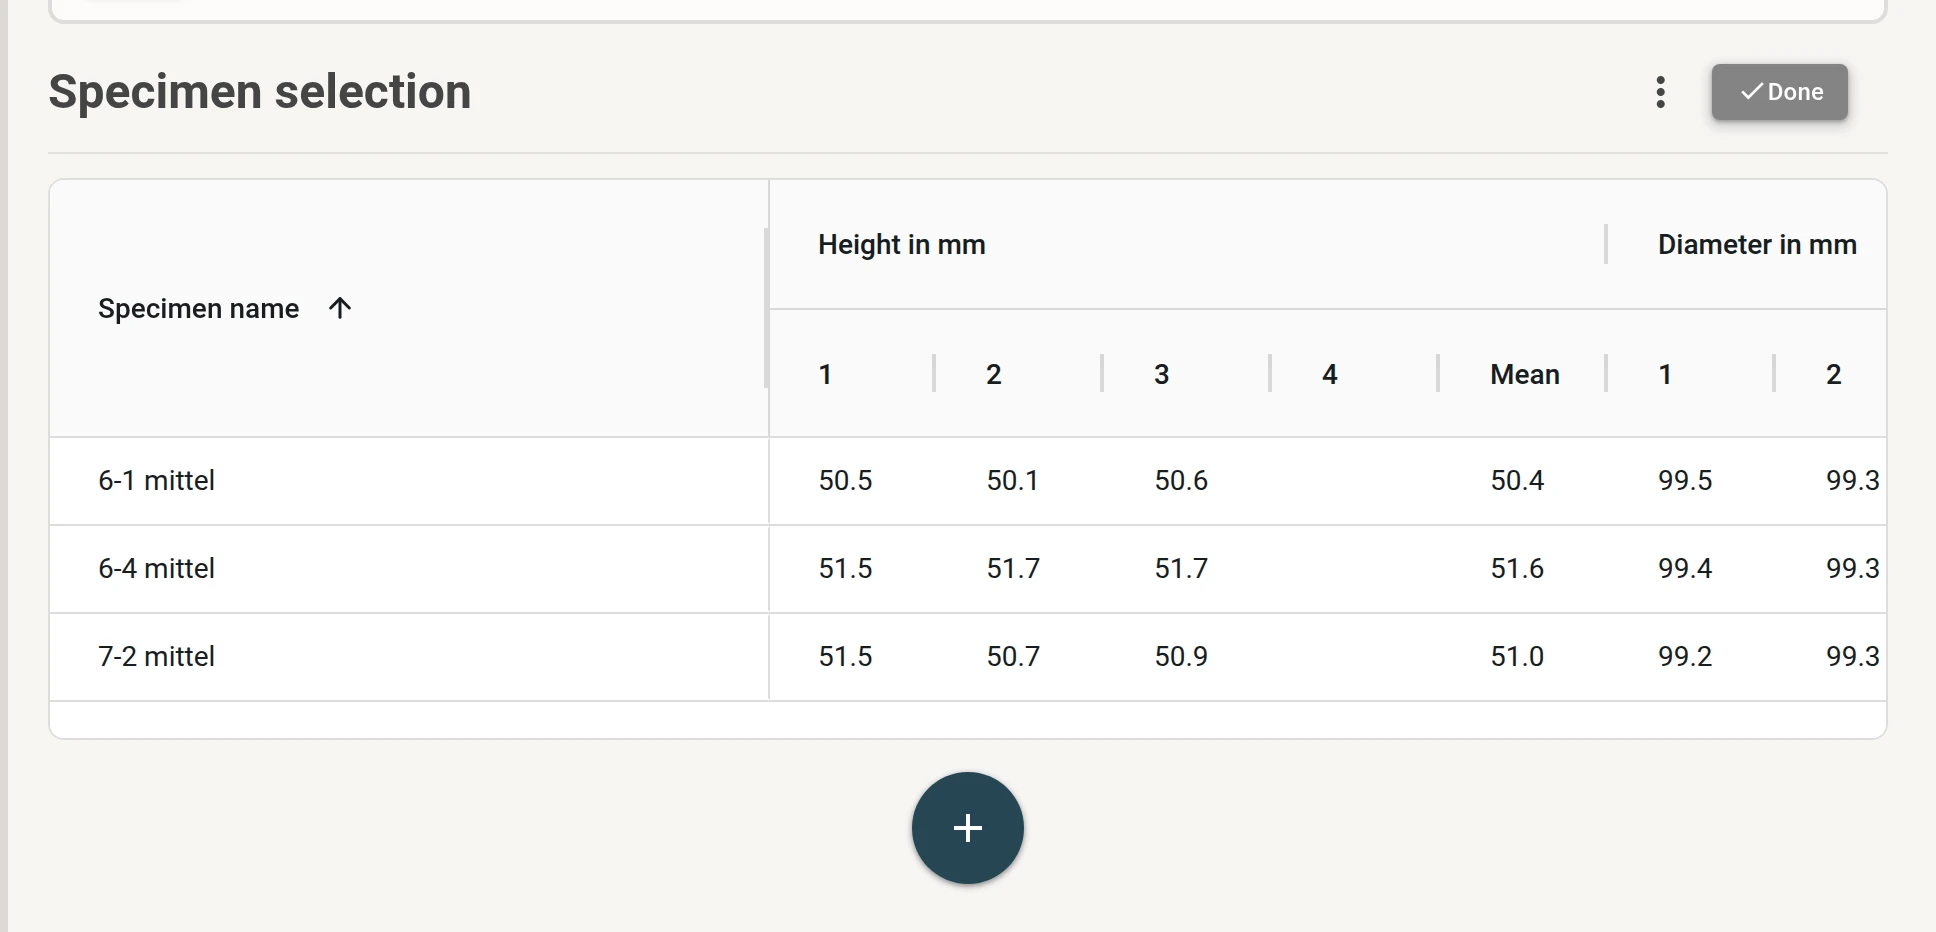
Which specimens go into a test is set directly on the task – with their dimensions and without printed lists.
Each specimen shows its height, diameter and bulk density. The statistics of the series show at once whether the specimens match, with outliers marked. Specimens from other tasks of the project can be reused.
Enter the dimensions straight into the table or import them from an Excel template – paveit calculates the averages.
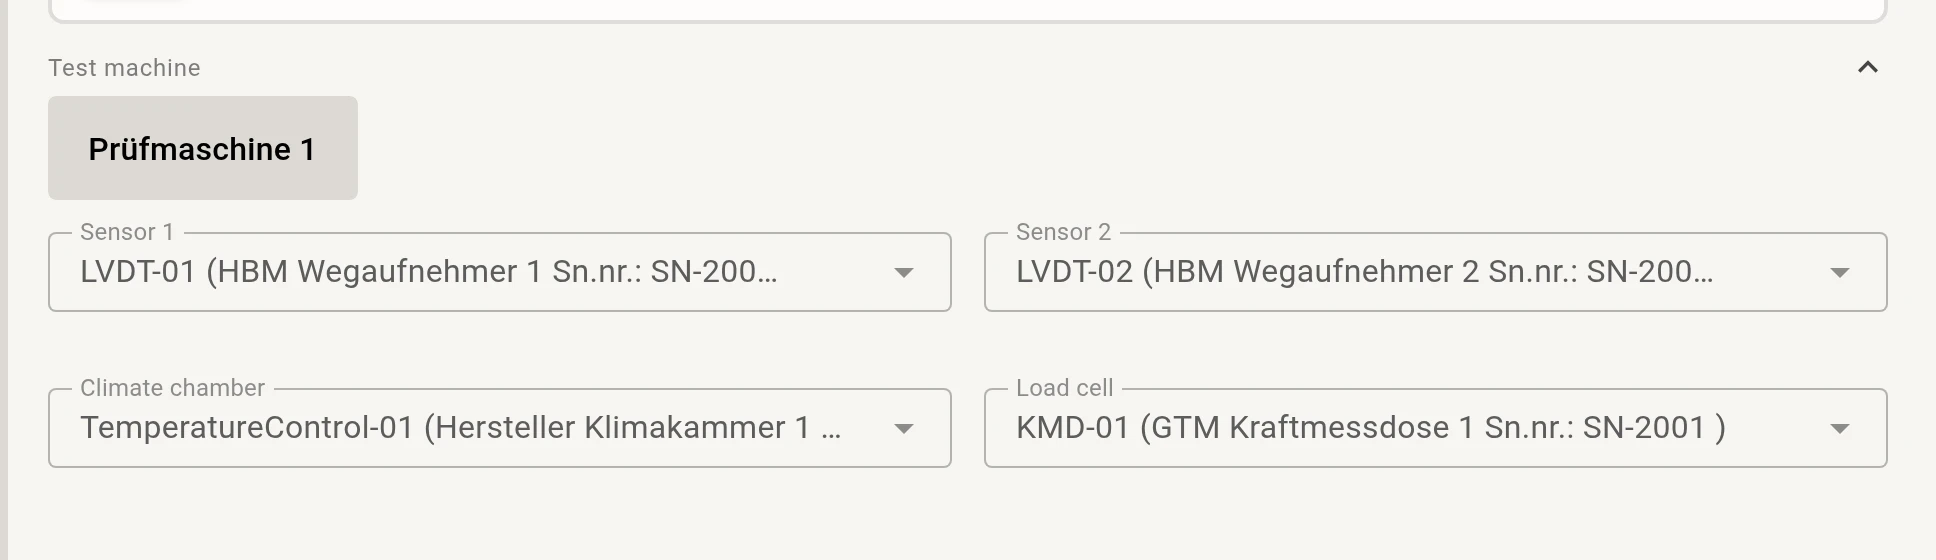
After the test, you upload the test machine's file. paveit knows which devices measured and shows at once what is still missing.
paveit fills in the displacement sensors, load cell and climate chamber for the chosen machine.
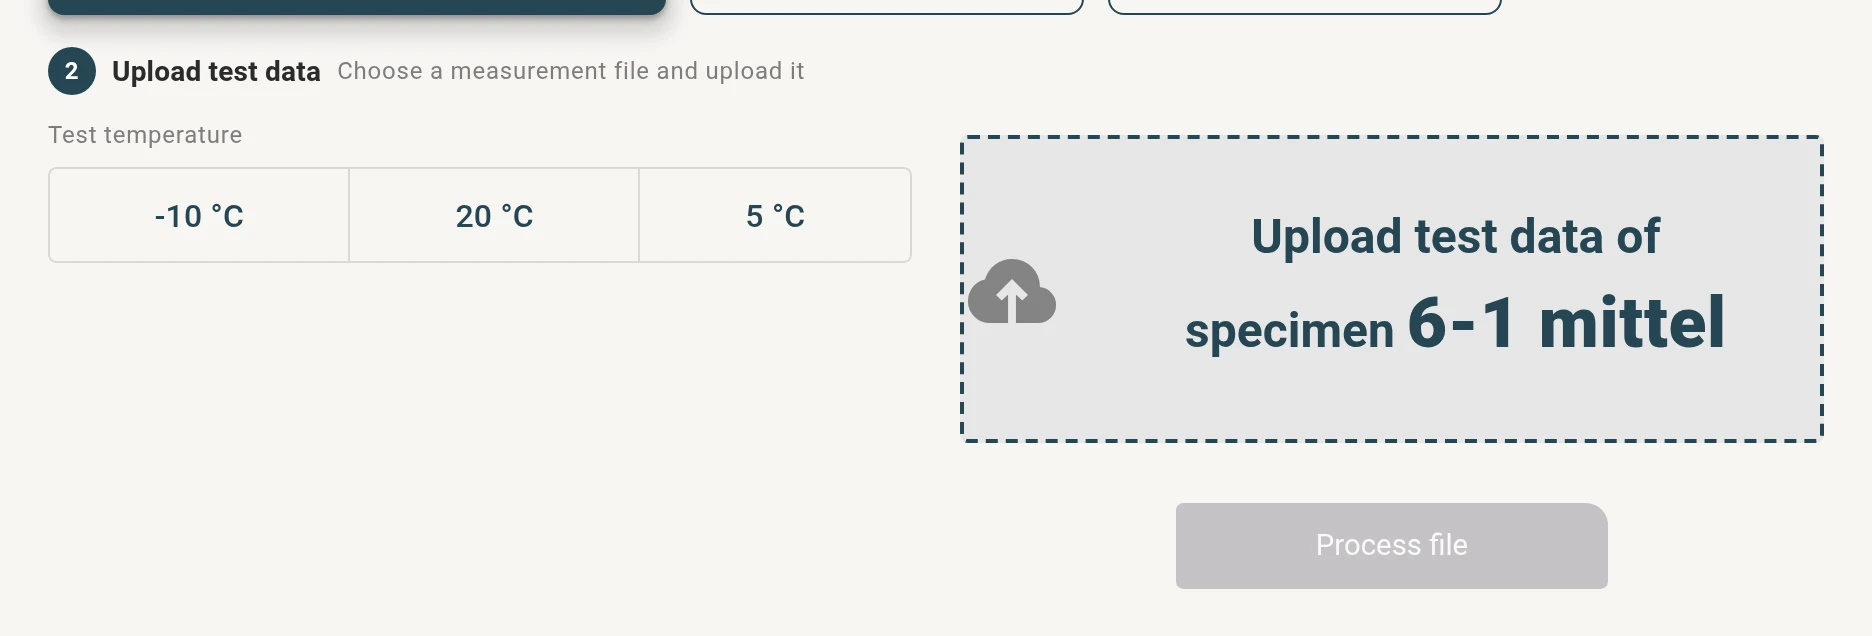
Drop the file into the field, done. As part of our service, we set up reading the files of every test machine for you.
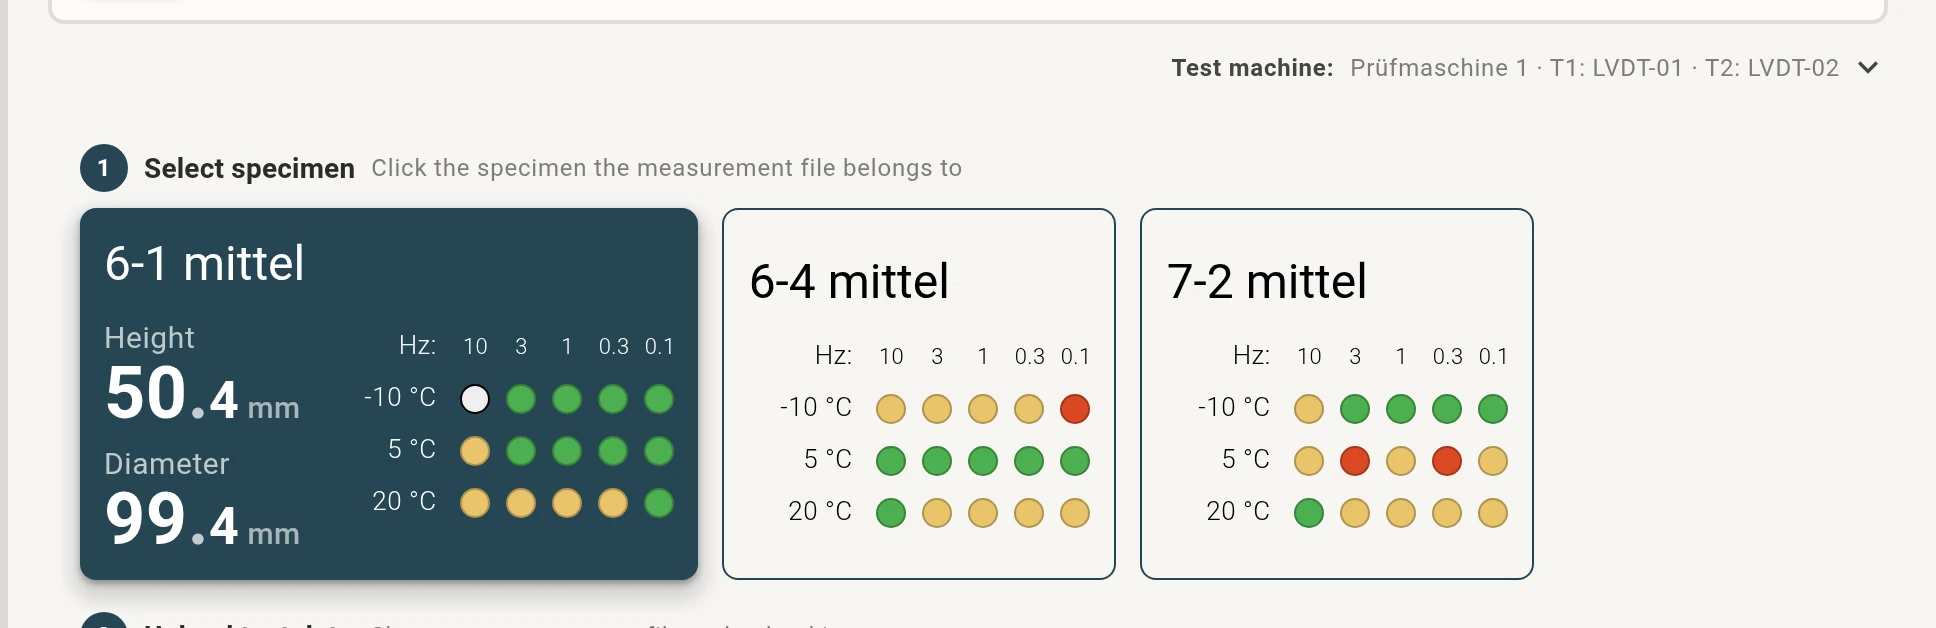
A grid of dots per specimen shows which measurements are already there and where a second look pays off.
No copying into spreadsheets, no macros: parameters and charts are ready shortly after the upload and grow with every further measurement of the series.
Master curve and charts are up to date after every file, including the uncertainty of the curve. So you can assess the results while the series is still running.
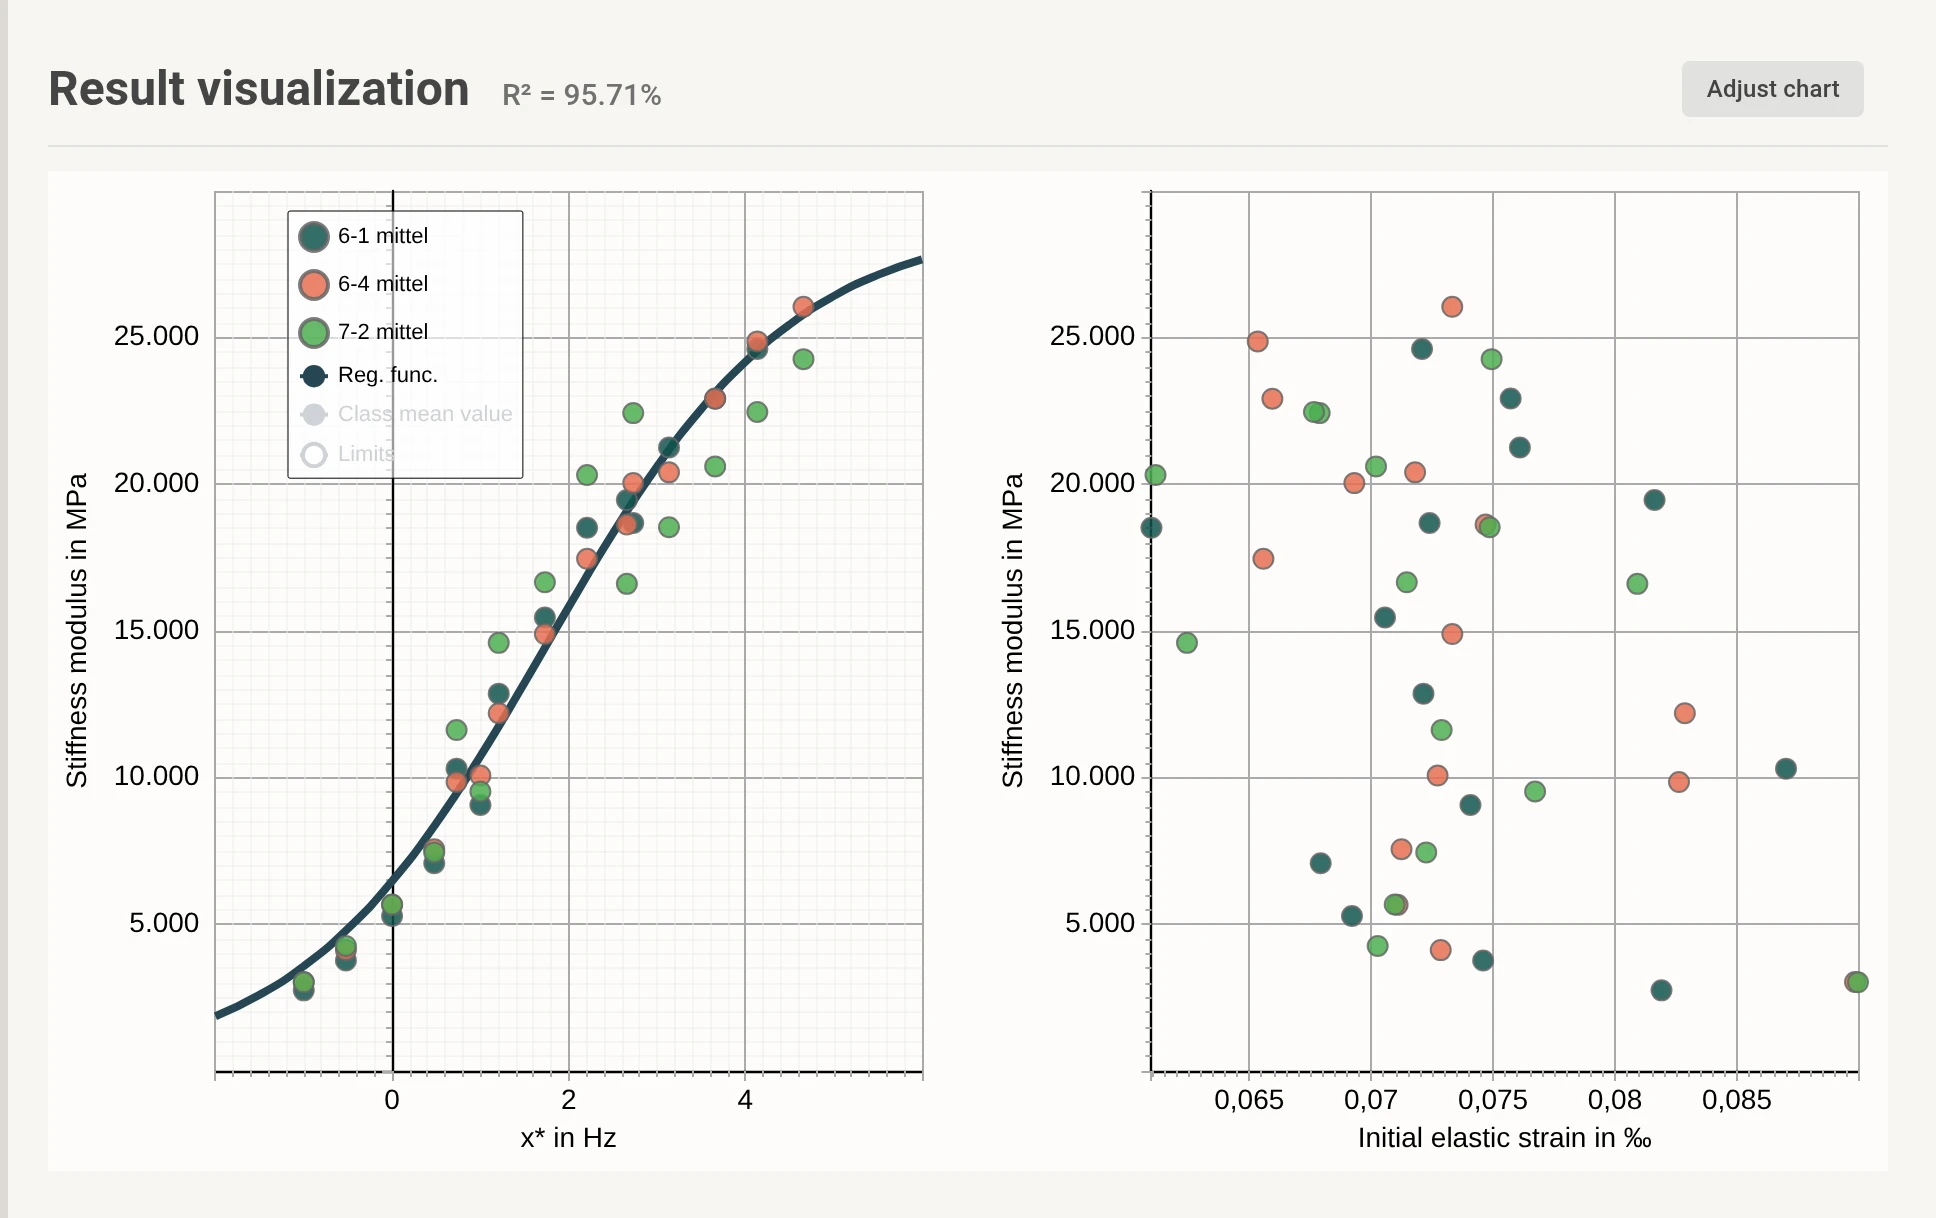
A click on a point shows the force and deformation curves of that measurement.
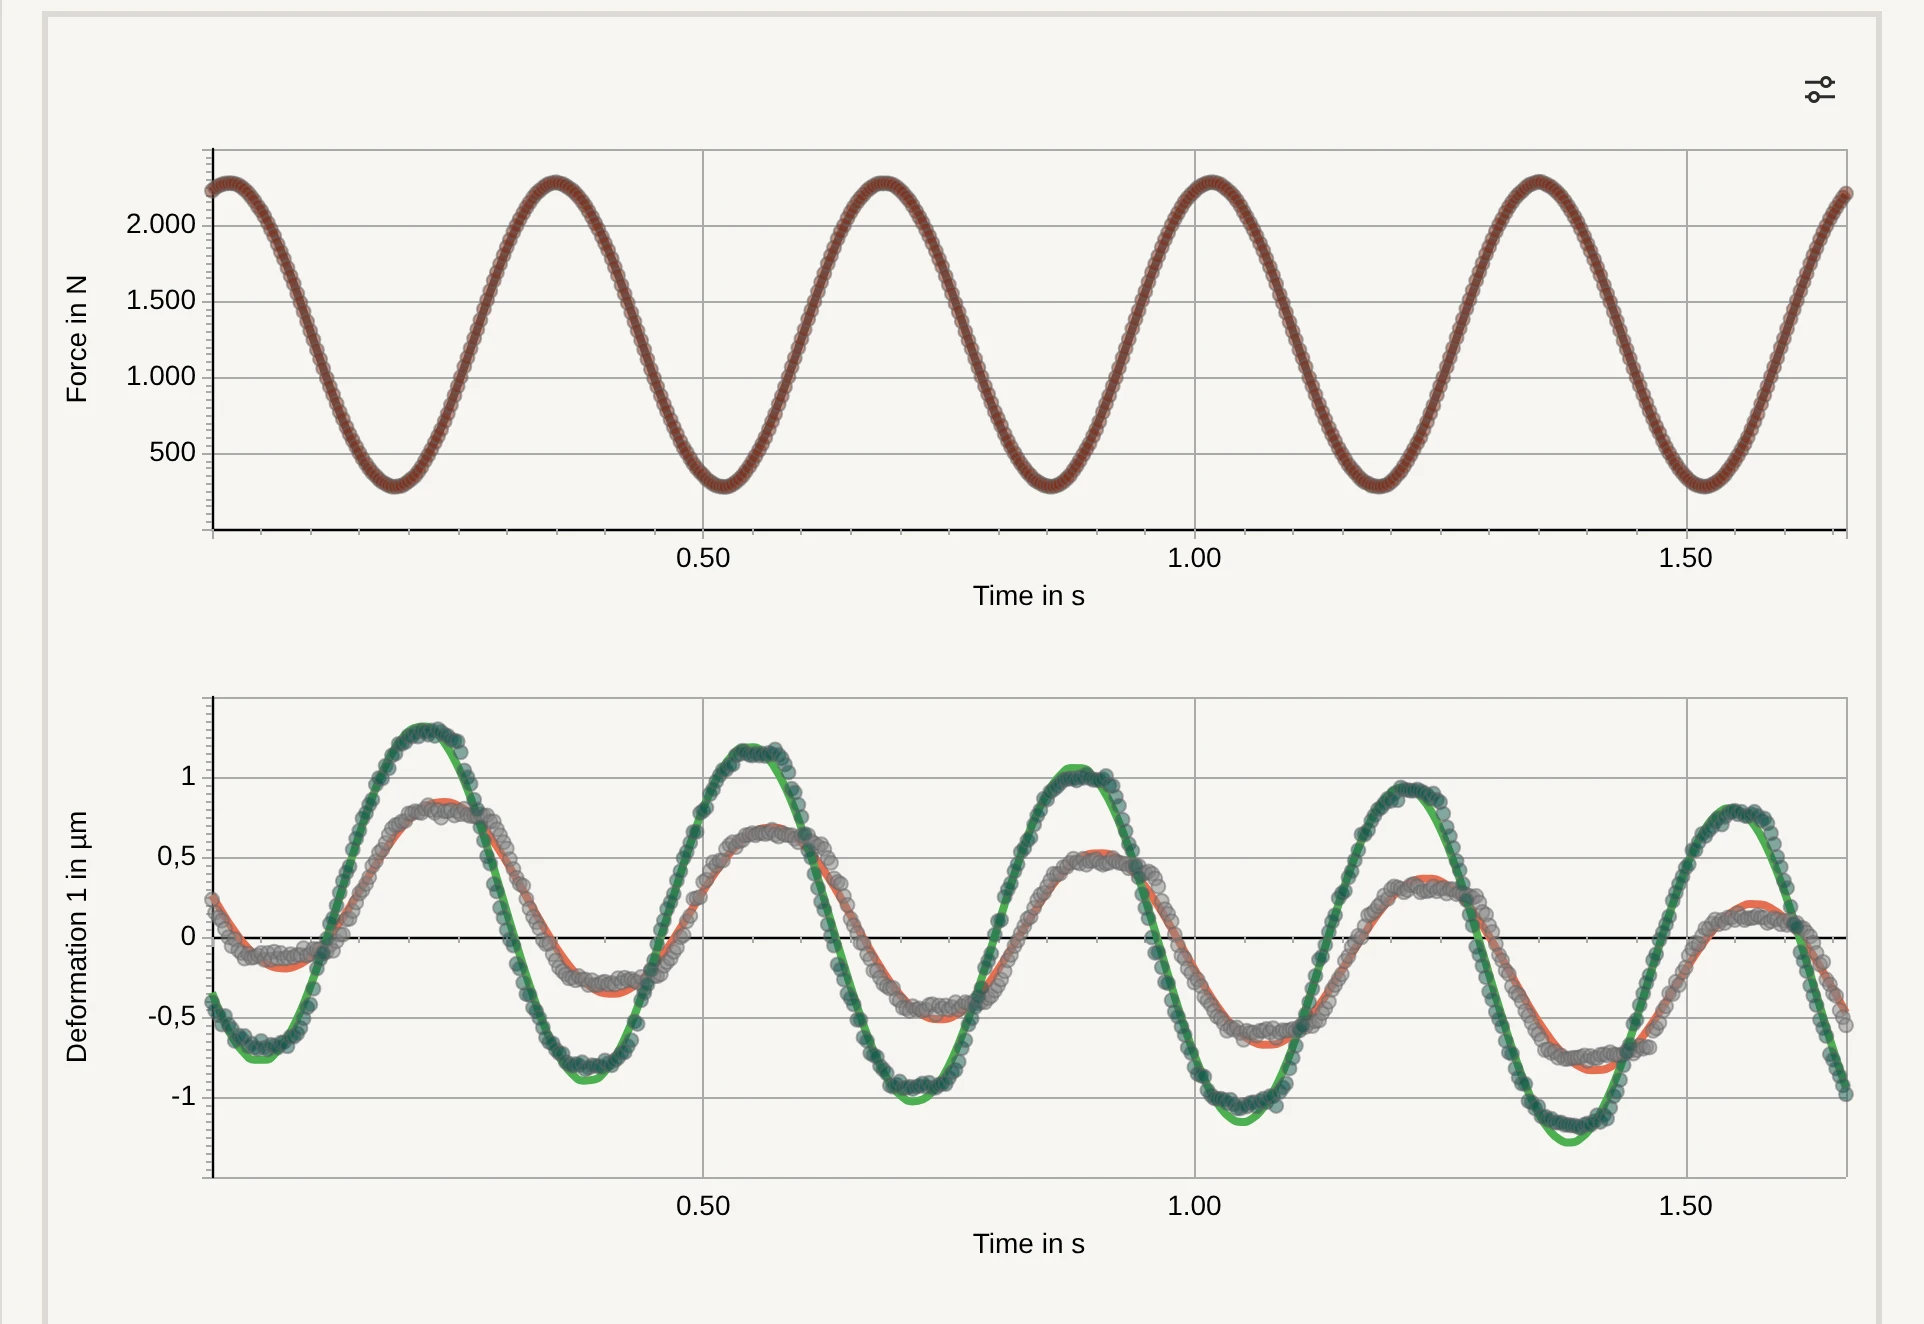
Quality scores for every measurement and for the whole series point out anything unusual. The decision stays with you.

The checked results become the test report – following the standard of the test, on your letterhead, ready for your client.
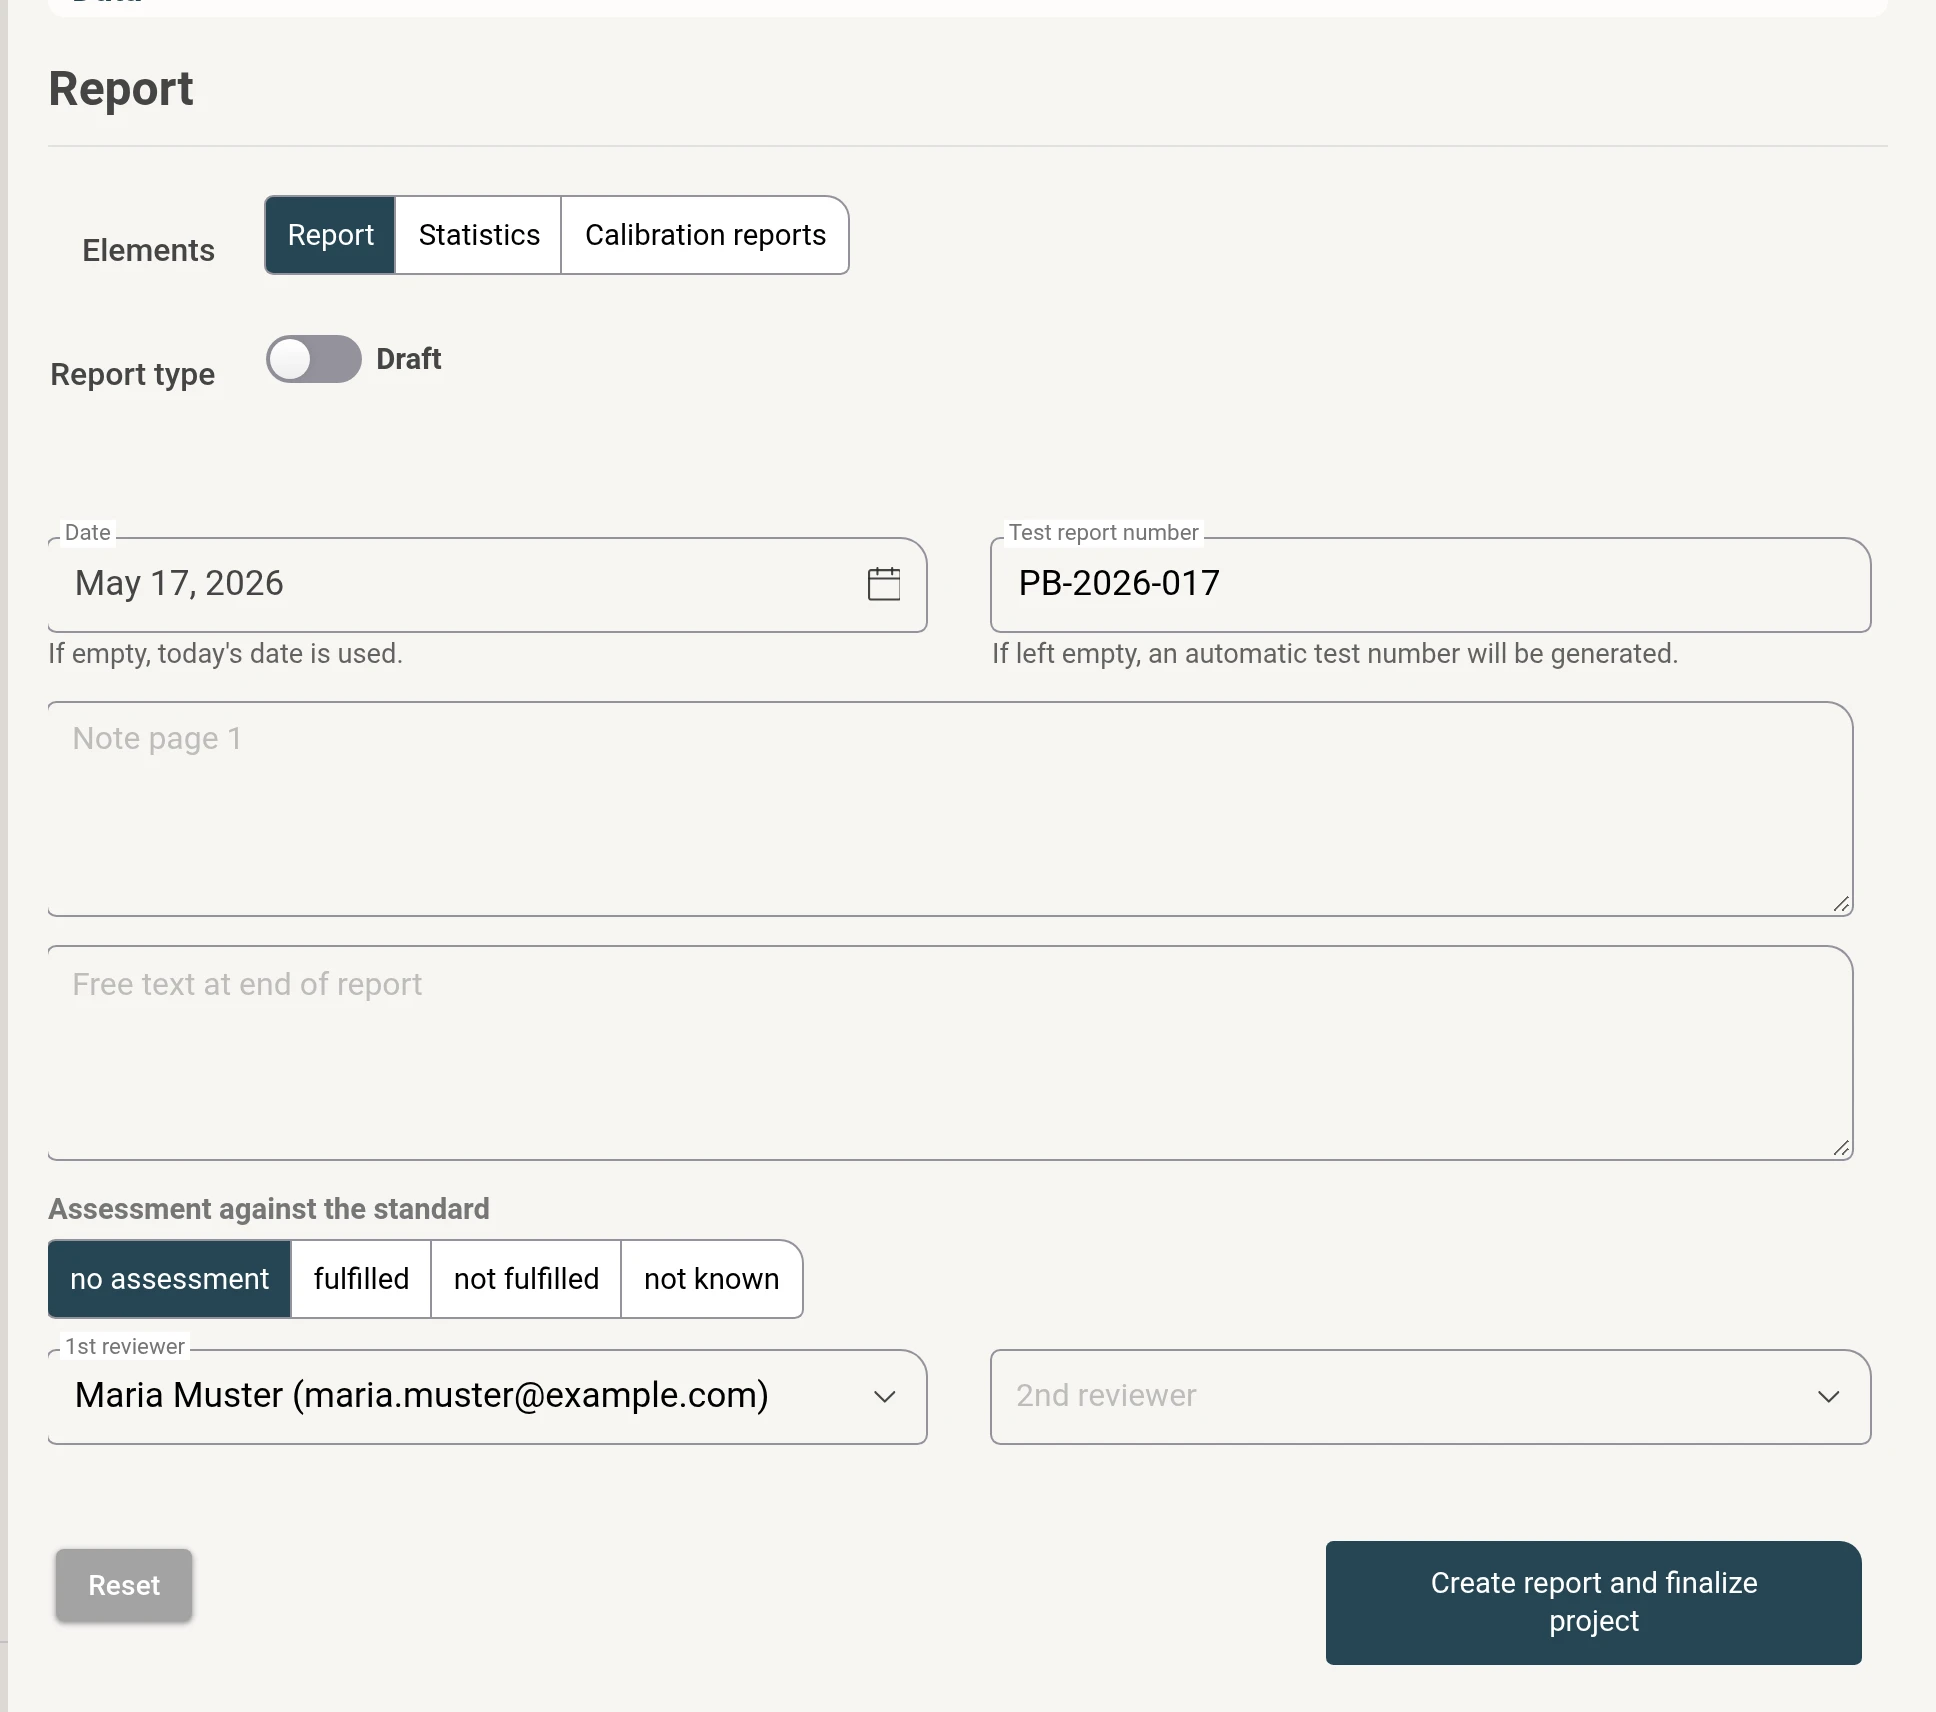
Choose contents and reviewers, done. If you like, with the statistics of the test series and the calibration certificates of the devices used.
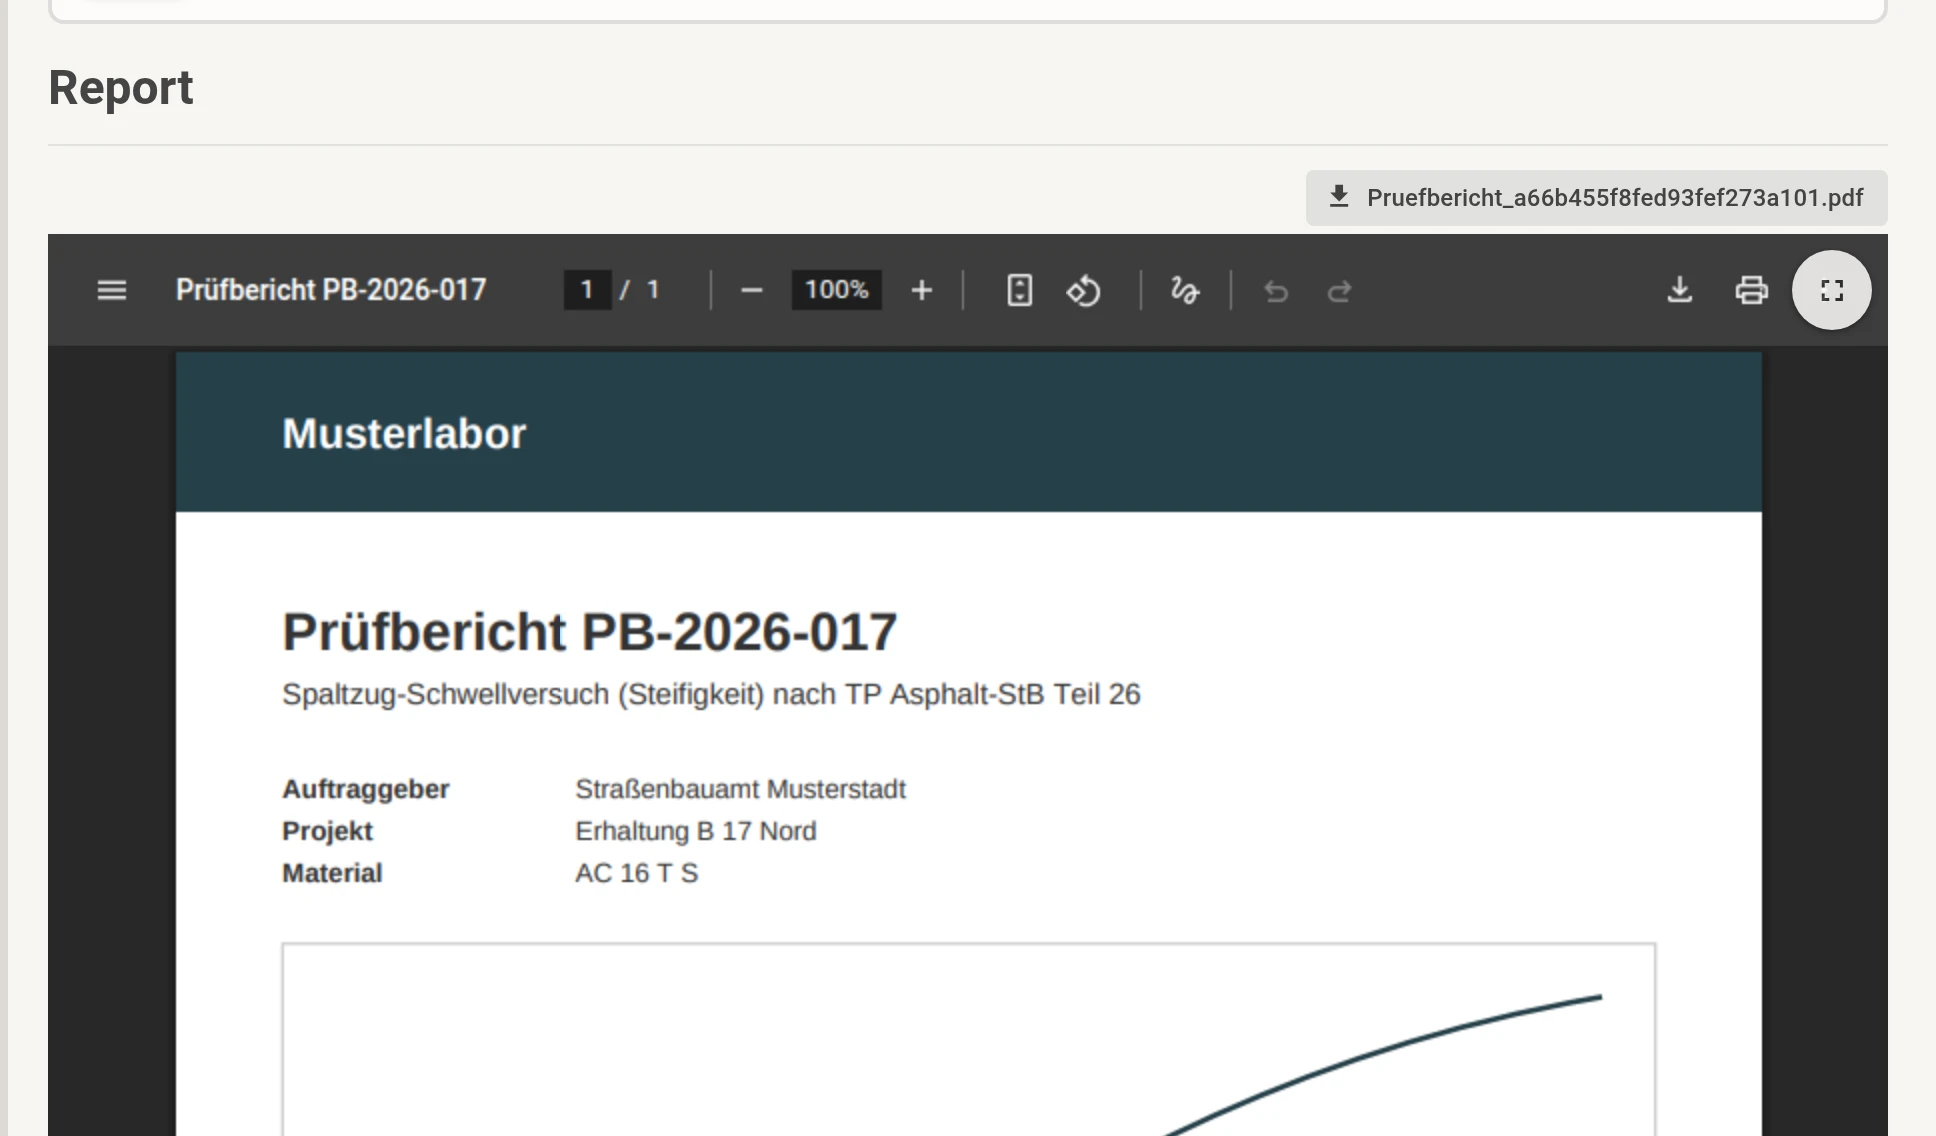
The report is attached to the task as a PDF. On your lab's letterhead, structured according to the standard of the test. Download it or view it full screen – ready for your client. Nothing needs to be retyped or reformatted.
Pavement Analysis and Design Tool